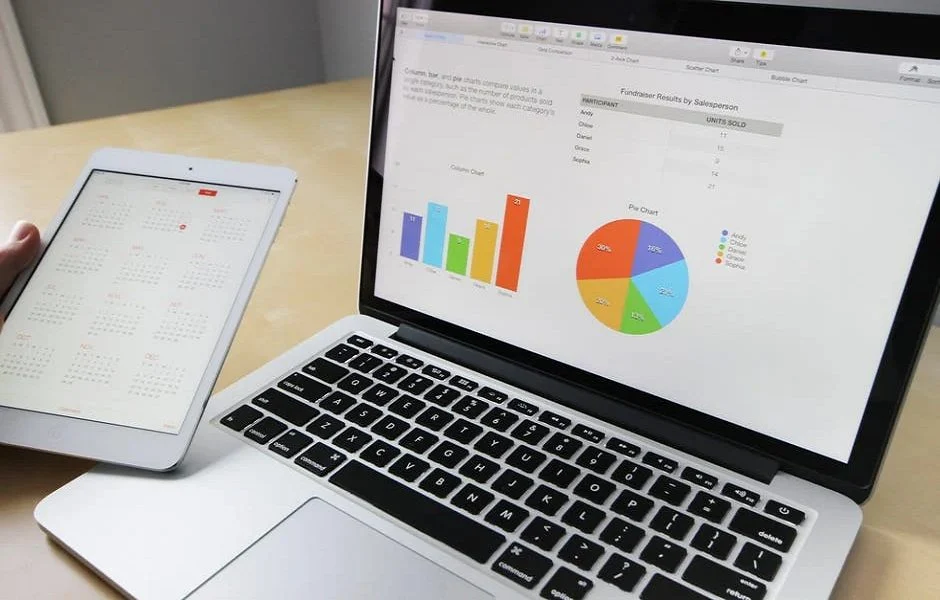
If you’re looking for ways to better convey important information and facilitate data analysis for the rest of your organization, here are some of the best data visualization techniques you can use to modernize your business.
 |
| Data Visualization Techniques |
4 Best Data Visualization Techniques to Modernize Your Business
Data visualization is the process of converting data sets into a visual presentation. It is mainly used to model events that cannot be perceived directly such as patterns, trends, or any other form of mathematical relationships between objects and entities.
As such, it has become an indispensable tool for a lot of applications such as presenting weather patterns or population growth trends. More importantly, it has become important for businesses, helping them communicate otherwise technical and specialized data for different departments and shareholders.
Read Here: What is Data Analysis in Qualitative Research?
If you’re an entrepreneur or a manager looking to better relay important information and make data analysis easier for the rest of your organization, here are four of the best data visualization techniques you can use for your business:
1. Line chart
The simplest method can be the most effective when used properly. Line charts, or line plots, are used to show a linear relationship between two variables. It is mainly composed of two axes, a vertical and a horizontal one, and data points corresponding to the intersection of these axes are connected in a line.
Line charts are mainly used to show how something changes with respect to a variable, mostly time. For general business purposes, it’s great for showing sales records. It can also be used for more specific applications such as monitoring equipment temperature for a specific timeframe.
Additionally, you can use multiple line trends, in a graph called a compound line chart, to show the comparison between different elements. For example, sales figures for a year between you and your competitors. Through this, you can easily show trends of both companies, as well as months where one outperforms the other.
2. Pie chart
Pie charts are used to visualize different parts of a whole, divided based on the size of each component. Mostly circular in shape, it is often divided into slices of different sizes corresponding to how large a component is. Thanks to online tools and apps like spreadsheets and presentations software, a pie chart can now be made more accurately.
Creating pie charts without any tool is difficult since humans are not instinctively equipped to make minute distinctions. This is also the disadvantage of this kind of data visualization strategy, the difficulty of distinguishing sections that are almost the same, not to mention the need for careful color choices.
Still, it’s great for presenting parts of a whole, such as attendance between departments or different contributors to workplace safety incidents. It’s helpful for identifying major contributors or components of a specific target you want to convey to your audience.
Another application for pie charts is in budgeting, showing how much-fixed capital will go to a specific expense. This is a good option for data visualization during product development or before opening a business.
3. Bar graph
Commonly overlapping with a pie chart, a bar graph is used to visualize the numeric values assigned to each category or component. Data is plotted on a plane of two axes, with each component having a corresponding bar whose length depends on the value associated with that specific section.
The main difference between a pie chart and a bar graph is that pie charts are intended to show how big a section has with respect to the entire set. Meanwhile, bar graphs are better suited for showing absolute values or proportions without the need to show them as a part of a whole.
A good example would be expenditures. If you need to show how much company funds go to different forms of expenses, bar graphs would be sufficient to relay this kind of information.
If you’re using bar graphs to show, say, revenue values per month, it can even be used in conjunction with a line graph to show absolute values per month as well as the overall trend.
4. Histogram
Often confused with a bar graph, histograms are actually used for visualizing the distribution of a continuous variable.
Visually speaking, the bars in a histogram are packed and connected together while bar graphs have gaps between the different bars. Viewed as a more technical data visualization technique, it is more used for statistical applications. Each of its bars is a specific value range, and the height of the bar is proportional to the frequency of entries or responses that fall within that range.
In businesses, histograms are particularly important for assessing process outcomes.
If you have a business process with different possible outcomes, you can gather data and sort them into this form of a chart. Any trend or tendency in that process should become apparent, helping you create a data-driven decision moving forward.
Read Here: How BI Tools Can Help Improve Your Business Performance?
Conclusion
There are other types of data visualization tools and techniques available, either separate or a variant of the examples listed above. The most important thing, however, is you familiarize yourself with generating and interpreting these techniques to help you better deliver important details for different shareholders in your company. By making sure everyone is on the same page, you can better make collective decisions and ultimately do what is best for the organization.
Read Also:
1. Why is Data Science So Important in Business Analysis?
2. Why Financial Accounting is Important for a Business?
3. How Artificial Intelligence is Shaping the Future of Business
4. What is Business Intelligence and How Do BI Tools Work?
5. Data Warehouse: Characteristics, Architecture and Principles of Data Warehousing
